PRESSURE/VOLUME DIAGRAM
Category
Dynamics Laws Describe Cardiac Cycle Better than Pressure/Volume Diagram
12/06/2017
di G. Bozzi
In the mid 1980s, we addressed the problem of objective analysis of left ventricle wall motion from angiography by testing the algorithms in prevalent use, but no satisfactory result was achieved, especially regarding contraction of the apex. This finding raised our suspicion that an error preceded the calculation. Since the beginning of the twentieth century, cardiologists have been taught that the heart follows the Frank-Starling law, a pressure/volume diagram, but we realized that the heart accelerates two masses of blood, so it must recoil according to the third principle of dynamics. This idea, and the concept of wall opposition at the apex, were translated into subroutines for normal contraction curve algorithms, allowing us to obtain an ideal contraction curve. This work demonstrates that the Frank-Starling law does not correctly describe cardiac activity. As a corollary, this work explains the mechanism of the systolic early relaxation phenomenon.
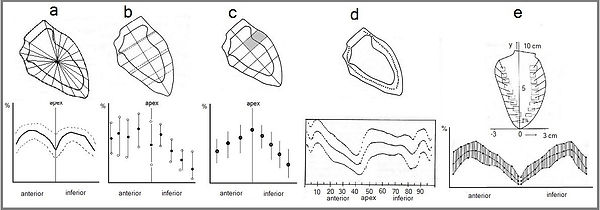
Figure 1. Five models of left ventricle wall motion analysis were available in the 1980s. a: shortening of radial segments2. b: shortening of segments orthogonal to the longitudinal axis3. c: reduction of areas orthogonal to the longitudinal axis4. d: centerline5 e: endo-myocardial markers6.
Results
A list of all tests executed has been previously published(7). In this paper, we present an example of an algorithmic test (Fig. 2) showing the possibility of selecting among several modalities of calculation according to objective data, but, even more, we suggest the presence of unsolved problems and therefore the possibility of formulating new hypotheses. The initial goal of this test was to determine how to subdivide the shortening of the longitudinal axis among 20 areas into which the silhouettes could be organized.
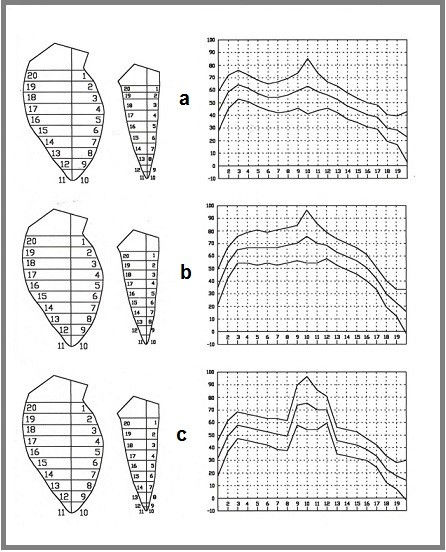
Figure 2. Example of algorithmic test. See text for explanation.
In Fig. 2a, the shortening of the longitudinal axis was assigned to basal areas 1, 2, 19, and 20. In Fig. 2b, it was divided equally among all areas. In Fig. 2c, it was assigned to apical areas 9, 10, 11, and 12. These results identified the scenario shown in Fig. 2b as the correct choice and also revealed two persistent problems: 1) a slope of the curve to the right and 2) high standard deviation values of apical points. Both of these issues suggest unsolved problems regarding the longitudinal axis.
The slope of the curve attracted our attention because of the observation that anatomical and angiographic apexes coincide while in diastole. This is not true in systole, because the anatomical apex remains stationary (as demonstrated by studies of implanted myocardial markers8, 9), while the angiographic apex shortens and rises. Furthermore, ascent of the apex suggests that a systolic twist of the heart is lost with the two-dimensional angiographic processing method. These observations justify free positioning of the proximal end of the longitudinal axes to divide the silhouettes into two parts as equally and symmetrically as possible. Regarding the high standard deviations of apical points, we noticed that pairs of similar normal silhouettes had a hyperkinetic apex in some cases and hypokinetic in others. This incongruity suggested an additional error preceding calculations. At this point, the pressure/volume diagram has been questioned because it uses static variables, whereas the heart accelerates two masses of blood and thus is obliged to follow dynamics laws. According to the second principle of dynamics, a simple calculation (Table 1) shows that while every heartbeat of an average male generates a force of about 0.67 Newton10 (N), which should cause shaking of the chest, heart activity is totally unnoticed. The only possible explanation is that heart activity takes place in a balanced manner; that is, during ejection, the heart shortens as much as it recoils due to the action/reaction principle. In the 30° right anterior
oblique projection, the aortic plane is lowered by about 1.5 cm during ejection (3, 11), with significantly greater shortening of the longitudinal axis.
Table 1. Calculation of the force generated by a single heartbeat.
We hypothesized that the difference between these two values would measure the affixing of the walls at the apex. This hypothesis, added to our algorithms, allowed us to obtain a contraction curve with an ideal shape (Fig. 3). To our knowledge, our method of wall motion analysis has the unique ability to produce responses comparable with agreed-upon diagnoses. Yet, a problem persists: the identification of silhouettes margins. In our experience, this task must be solved by expert angiographers moving the film back and forth, as no algorithm will be able to solve the problem of incorrect margin recognition due to the loss of a dimension and the superimposition of contrast layers in certain pathologies such as ventricular aneurysms.
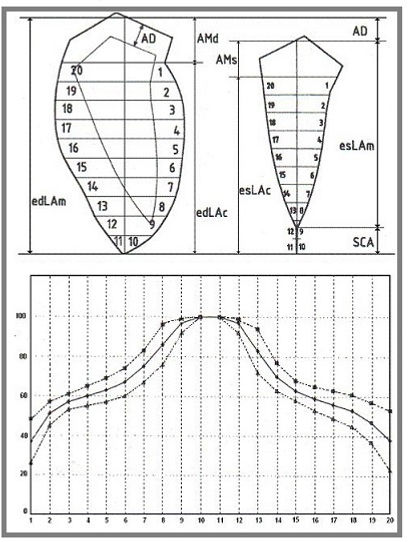
Figure 3. Model of calculation and Mean contraction curve. a: graphic representation of the model for left ventricle wall motion analysis. AD: aortic descent. AMd: Distance between the proximal end of the longitudinal axis (LA) and the mitral fornix or, in this case, the boundary between the outflow tract and the antero-basal wall. AMs: systolic equivalent of AMd, obtained by calculation. edLAm: end-diastolic LA measured. edLAc: end-diastolic LA re-calculated. esLAc: end-systolic LA re-calculated. esLAm: end-systolic LA measured. SCA: systolic concealed apex. b: mean normal contraction curve ± 1 standard deviation.
Discussion
The major criticisms of the Frank-Starling law are: 1) the use of static variables to describe gasses and 2) failure to use variable time, which is essential to explain the re-elongation of cardiac fibers due to electrical and external mechanical forces. This over-simplification of the cardiac cycle has biased the attempts of objective analysis of left ventricle wall motion. The heart (weighing about 300 g) of a normal man pushes more than 17,000 liters of blood every 24 hours. It is reasonable to assume that this system is sophisticated, exploiting all physics rules and tricks. For example, aortic valve closure 1.5 cm below the point of its opening gains about 1,000 liters of blood every day. The angiographic technique loses a dimension and turns this complex three-dimensional phenomenon into a two-dimensional sequence of images. It is reasonable to analyze these images in numerical terms, but it is essential to keep in mind what exactly happens, what data can be used, and how.
Results of our tests suggest a description of the cardiac cycle based on dynamics principles. At the beginning of systole, isometric contraction causes a narrowing of the outflow tract and a slight lengthening of the ventricle; ventricular blood assumes the shape of a cylinder plus an inverted cone (Fig. 4, a). When the pressure in the ventricle exceeds the aortic pressure, the valve opens, and part of this cylinder is pushed into the aorta without vortices (Fig. 4, b). This cylinder has a base of about 7 cm2 and a length varying from 9 to 13 cm. According to the action/reaction principle, the heart recoils during ejection, and the ascending aorta accumulates elastic energy into the walls.
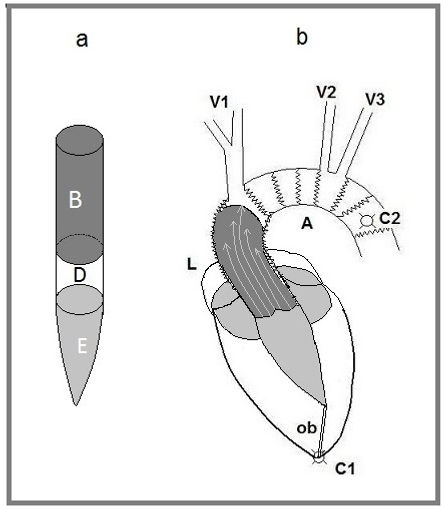
Figure 4. Mechanical representation of the heart-aorta system. a: B stroke volume. E residual ventricular volume. D part of the blood cylinder that can belong to B or E according to venous return and adrenergic tone. b: C1 and C2 fixing points of the system; aortic plane is free to move. ob obliterated part of the apical shell. L ascending aorta with elastic lamina favoring elongation. A aortic arc with elastic lamina favoring enlargement. V1, V2, and V3 elastic suspensions of the aortic arch; in case of intense activity, the arch can perform a rocker movement, with C2 being the fulcrum. Dark grey stroke volume; light arrows indicate laminar flux with different layer velocities. Light grey residual volume and left atrial blood making a unique mass at the time of aortic recall.
Soon after ejection, diastole begins by elastic recall of the aorta (Fig. 5), which causes longitudinal distension of the ventricle, while atrial blood and residual ventricular volume, moving down from the recoil, persist in their position and push ventricular walls laterally when the heart rises. This description explains the stretching of myocardial fibers, as the heart is the sole striated muscle devoid of antagonistic muscles. This critical point requires analysis of the relationship between electrical and mechanical phenomena of the heart12. For a heart rate of 70 beats/min, the electrical systole (QTc of the
electrocardiogram) lasts about 360 ms, whereas ejection lasts about 250 ms. The difference in the electrical systole (110 ms) is the available time for biochemical mechanisms to complete the removal of calcium ions from myofibrils, which is essential to allow their elongation, before elastic recall occurs.
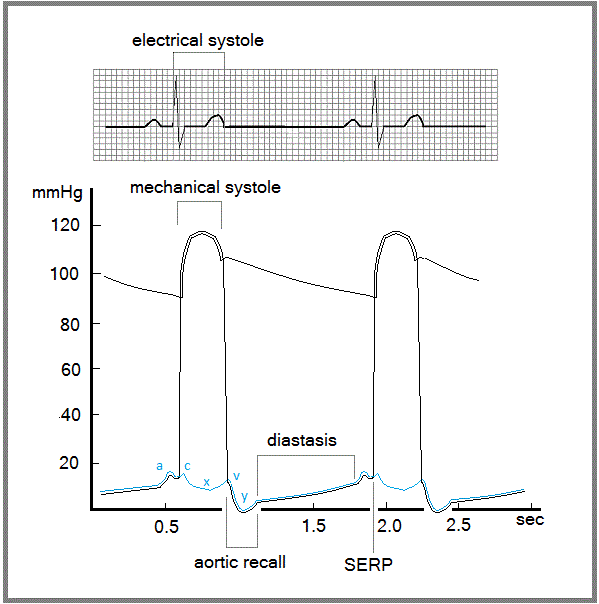
Figure5. Temporal relationship between electrical and mechanical activity of the heart. Electrical systole corresponds to the QT interval of the electrocardiogram. The y depression of the atrial and ventricular curves corresponds to aortic recall, suggesting that rapid filling of the ventricle does not depend on pressure into the cavities but on external forces.
This description of the cardiac cycle explains the mechanism of the systolic early relaxation phenomenon (SERP), which until now has not been well understood. When removal of calcium ions from some cardiac myofibrils is delayed, the affected fibers fail to relax, preventing their extension due to elastic recall of the aorta (Fig. 5). Even if calcium ions are removed during the following period (i.e., diastasis), no forces are able to stretch the fibers, which remain shortened. Increasing pressure during
the next systole finally lengthens these fibers. This phenomenon, currently known as SERP, should more accurately be referred to as the delayed relaxation phenomenon (DeRP).
Methods
The basis of our searching method is the use of algorithmic tests considering that a complex logical problem can be subdivided into several more simple parts; each part becomes subjected to a mathematical/logical test, and an expert of that topic selects the more appropriate result of each test. Furthermore, this method allows the formulation of new hypotheses, which can be subjected to appropriate new tests. The contraction/relaxation cycle of the heart is a complex three-dimensional phenomenon, whereas its angiographic elaboration, which loses a dimension and superimposes all layers, makes its de-codification difficult. The algorithmic test method seems particularly adept at solving this problem.
To collect and store data and perform calculations, we used an IBM-XT PC, a graphic tablet CalComp Drawing Board III, and a graphic printer. Algorithms were written in Quick Basic (QB Microsoft®) language. Although the program can run on Windows Operating Systems up to Windows XP, we believe that these algorithms should be re-written in a modern object-oriented language.
At the beginning of this work in 1985, we began re-reading angiographies from our catheterization laboratory archives, looking for normal left ventriculographies and writing algorithms for test execution. After about a year and a half of work (having re-read more than 1,500 examinations), we had 14 available normal cases and reliable algorithms for test execution. We stopped looking for more normal cases because after 12, standard deviations did not further decrease. Each algorithm was tested according to its function; area-measuring algorithms were verified by measuring segments and areas of known dimensions. Statistical algorithms were tested according to examples in a statistics textbook13, and the correspondence of results was checked. An additional two years of work were required to complete the diagnostic algorithms, to test them on various types of wall motion abnormalities, and to verify the correspondence between objective evaluation and subjective diagnosis.
References
-
Katz, A.M. Ernest Henry Starling, His Predecessors, and the "Law of the Heart". Circulation 106: 2986-2992 (2002).
-
Jeppson, G.M., et al.: Changes in Left Ventricular Wall Motion After Coronary Artery Bypass Surgery: Signal or Noise? Circulation 64: 945-951 (1981).
-
Leighton, R. F., Wilt, S. M., & Lewis, R. P. Detection of Hypokinesis by a Quantitative Analysis of Left Ventricular Cineangiograms. Circulation 50: 121-127 (1974).
-
Pasternac, A., Gorlin, R., Sonnenblick, E. H., Haft, J. I., & Kemp, H. G. Abnormalities of Ventricular Motion Induced by Atrial Pacing in Coronary Artery Disease. Circulation 45: 1195-1205 (1972).
-
Sheehan, F., et al.: Variability in the measurement of regional left ventricular wall motion from contrast angiograms. Circulation 68: 550-559 (1982).
-
Slager, C. J., et al. Endocardial Landmark Motion; A New Approach to the Assessment of Regional Left Ventricular Performance. In Computer Analysis of Left Ventricular Cineangiograms. 39-73. (ed. The Dutch Heart Foundation) (Amsterdam 1982).
-
Bozzi, G., Verna, E., Skinner, J.M., Dwyer, M., Castelfranco, M. Quantitative Regional Contraction Analysis of Cineventriculography: Reporting, Filing, and Retrieval Functions Using a Personal Computer. Cathet Cardiovasc Diagn 18: 50-59 (1989).
-
McDonald, I. G. The Shape and Movements of the Human Left Ventricle during Systole. Amer J Cardiol 26: 221-230 (1970).
-
Ingels, N. B., Daughters, G. T., Stinson, E. B., & Alderman, E. L. Measurement of Midwall Myocardial Dynamics in Intact Man by Radiography of Surgically Implanted Markers.
Circulation 52: 859-867 (1975).
10. Lentner, C. Unità di misura, Liquidi corporei, Composizione del corpo, Nutrizione. In Tavole
Scientifiche Geigy 1. (ed. Ciba-Geigy Limited) 21- 22 ( Basilea 1983).
11. Nogueira, E. A., Carvalhal, S. S., MacMillan, R. M., & Maranhao, V. Analysis of the Position of the Left Ventricular Apex and Base during Systole. Cathet Cardiovasc Diagn 13: 253-261 (1987).
12. Obbiassi, M. Genesi delle F.E.M. Cardiache. In Il Campo Elettrico Cardiaco. (ed. Recordati) 42-56 (Milano, 1964).
13. Lison, L. Examples in Statistica Applicata alla Biologia Sperimentale. (ed. Ambrosiana) 37-64 (Milano, 1961).
Recent Posts
The discovery of a withholding lost mail ignites a controversy
18/05/2016
An angiographic phenomenon not well explained up to now.
27/08/2016
The heart is a very efficient hydrodynamic pump
11/03/2016
